
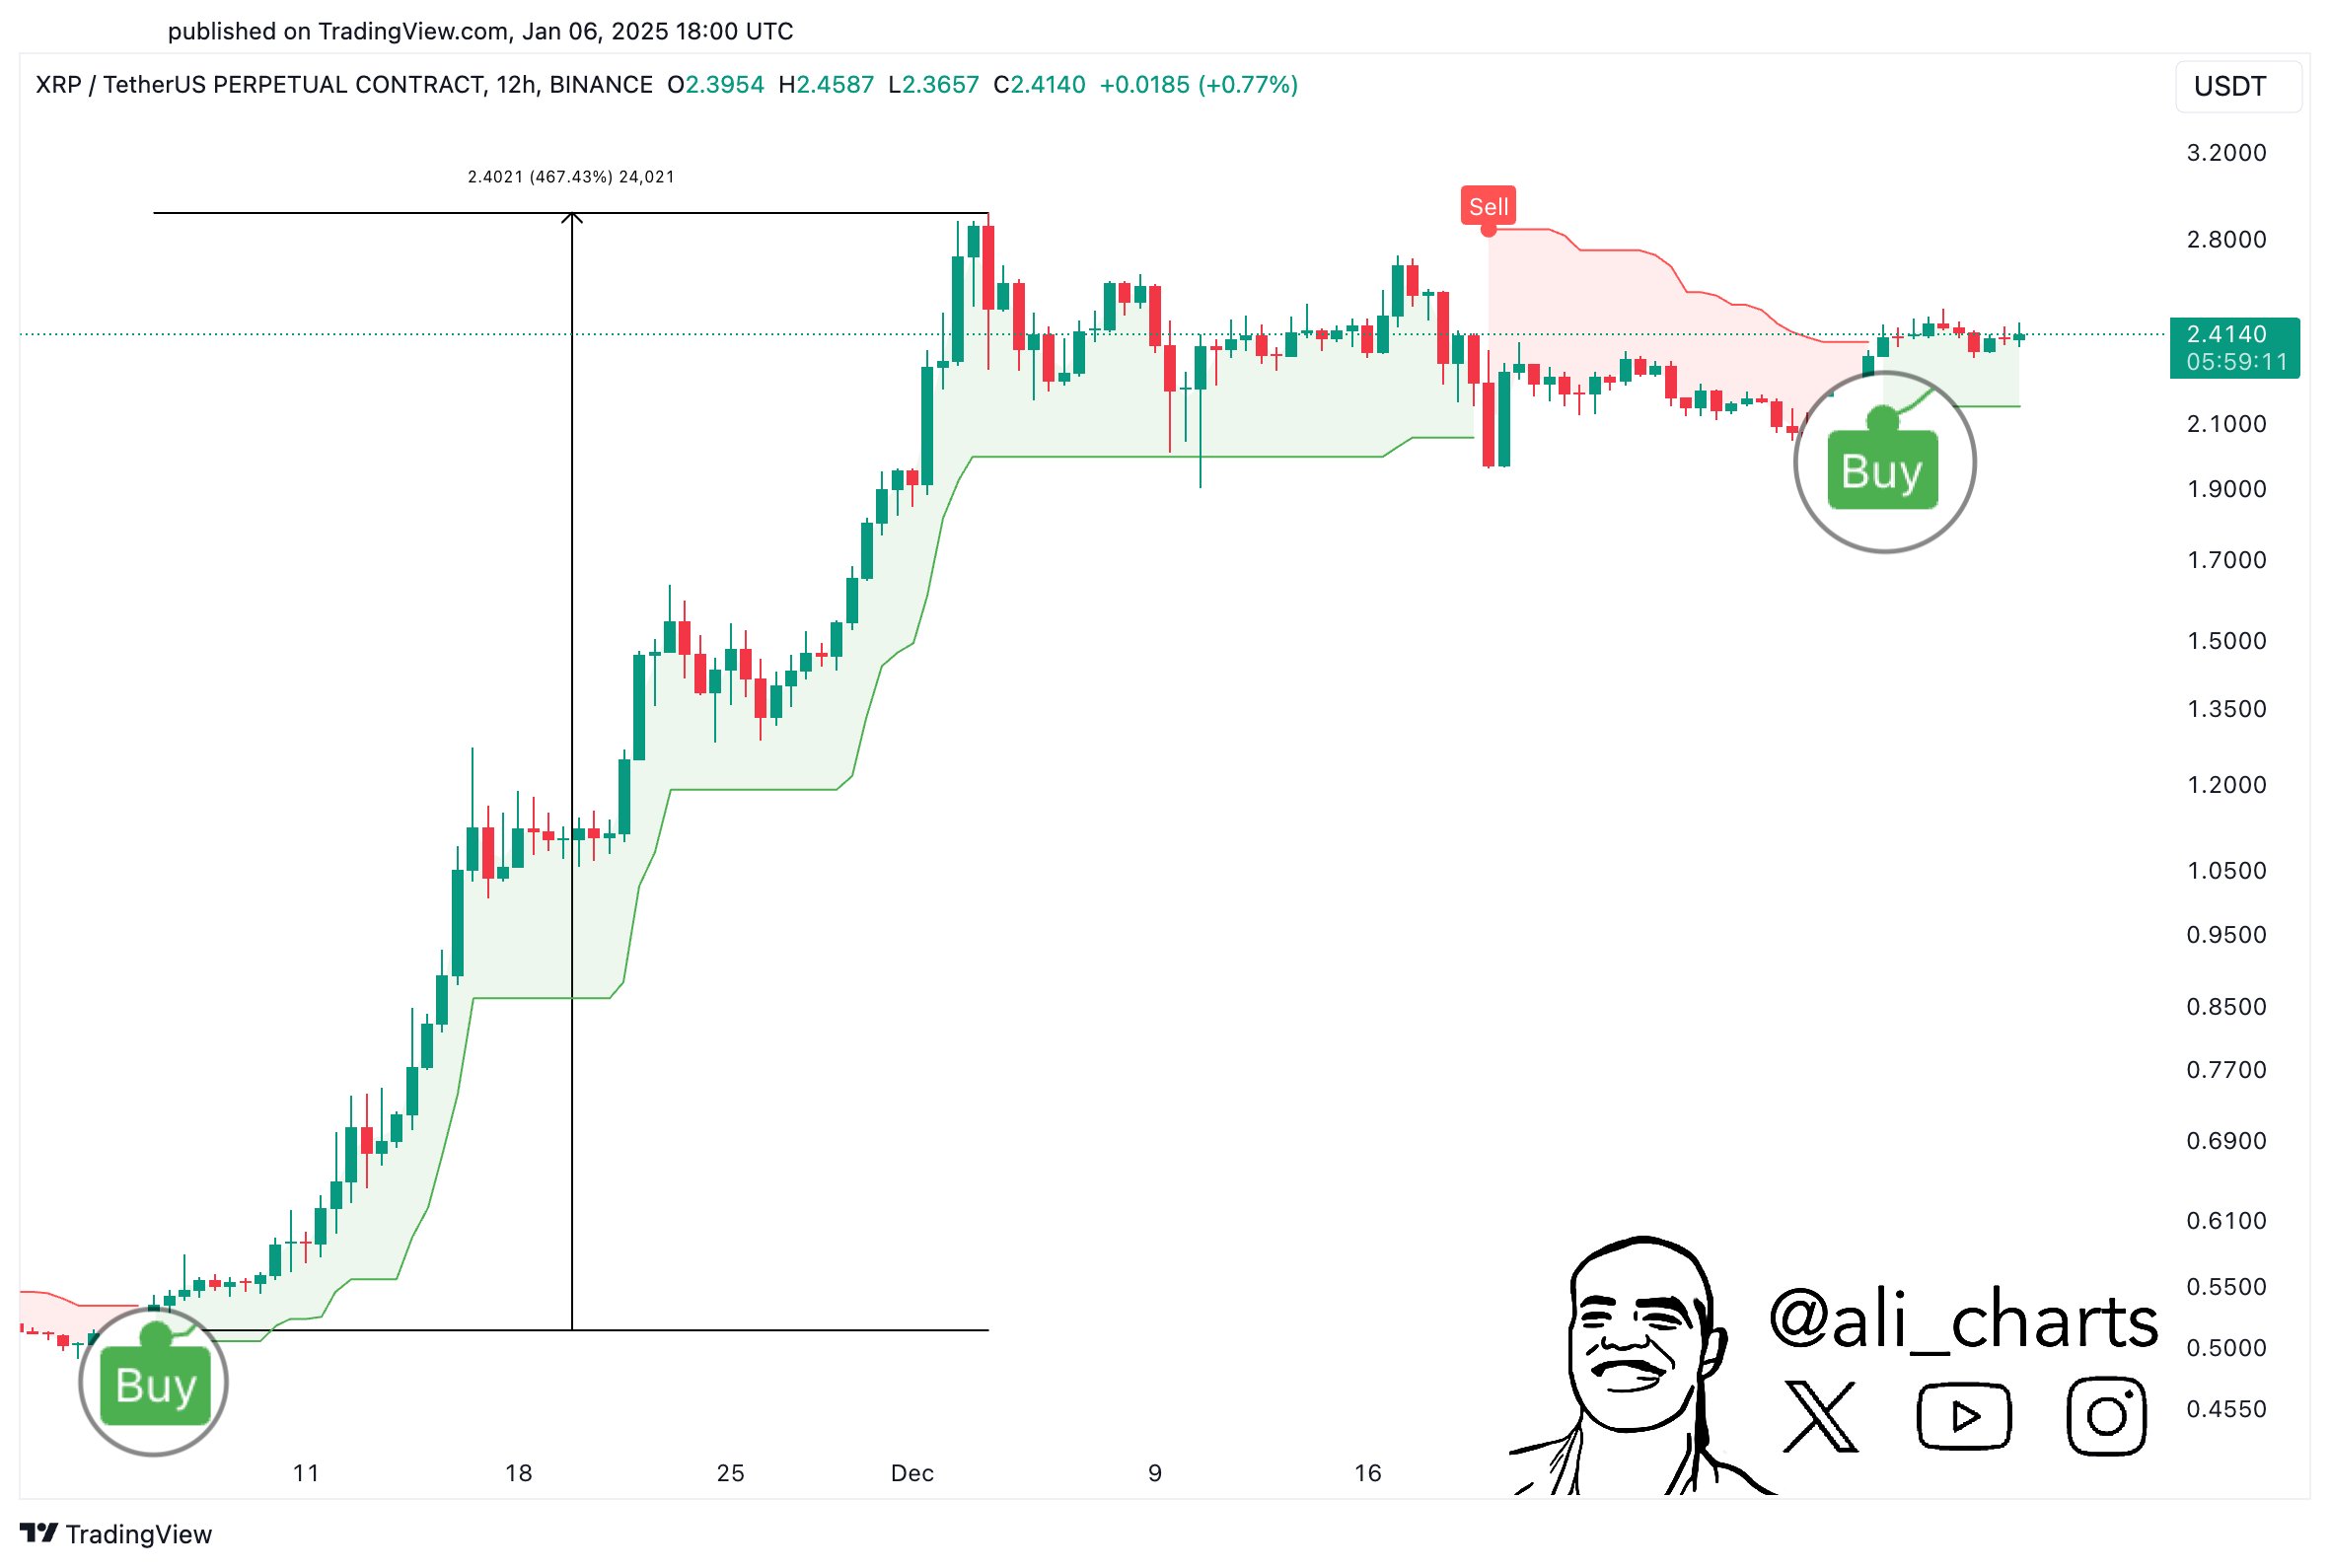
In a technical analysis shared on X, noted crypto analyst Ali Martinez (@ali_charts) has drawn attention to a potentially significant bullish signal for XRP. Martinez highlighted that the Supertrend indicator, applied to the 12-hour chart of XRP/USDT, has shifted to a bullish position – a pattern that preceded the 470% price surge last time around.
“The last time the Supertrend indicator flipped bullish on the 12-hour chart, XRP was up 470%… it just flipped bullish again,” Martinez wrote By X and shared the chart below.
What this means for the XRP price
The Supertrend Indicator is a popular trend-following technical analysis tool developed by Olivier Seban. It overlays on price charts and helps traders identify prevailing market trends by dynamically adjusting based on volatility. The indicator primarily uses the Average True Range (ATR) to determine its position in relation to price movement, providing clear buy and sell signals.
Related reading
The supertrend is calculated using the ATR and the multiplier (usually set to 3). It plots a line above or below the price, changing its position when the price crosses these levels. A bullish flip occurs when the indicator moves below the price, indicating a potential uptrend. Conversely, a bearish flip occurs when it moves above the price, indicating a possible decline.
Martinez cited the last occasion where the supertrend indicator reversed sharply on XRP’s 12-hour chart, which subsequently led to a staggering 470% price increase. The last bullish flip came in November last year, where XRP was trading at around $0.50. After the flip, XRP entered a strong uptrend, breaking through key resistance levels and peaking at $2.90 on December 3, representing a 470% gain from its pre-flip valuation.
Related reading
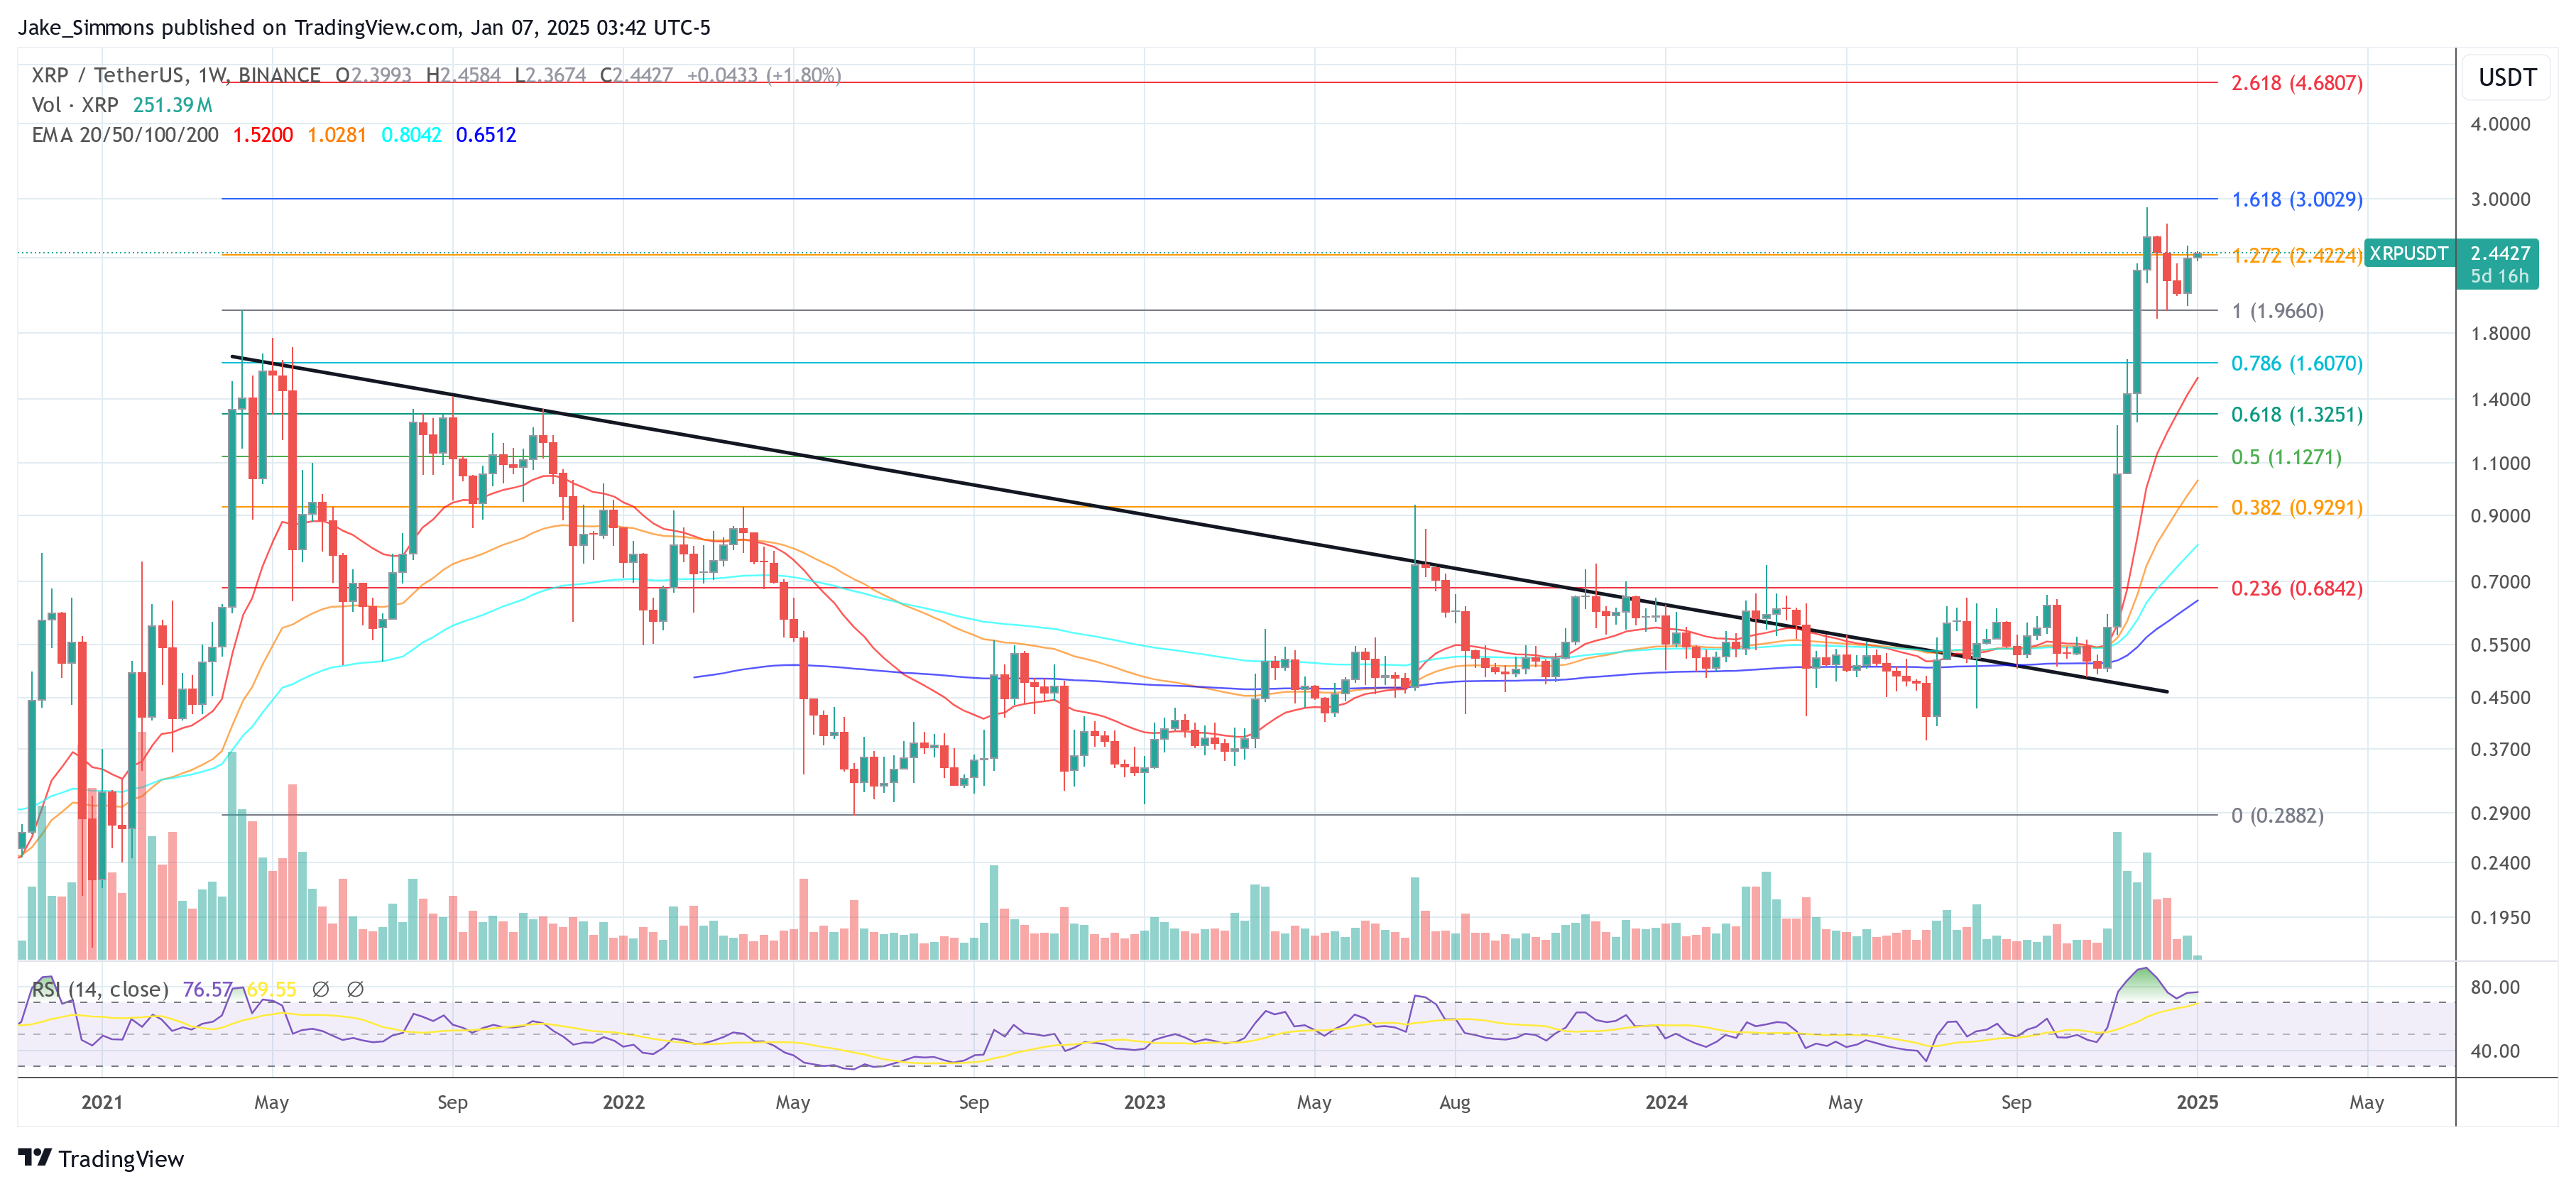
According to Martinez, the Supertrend indicator has turned bullish again on the 12-hour chart. This resurgence suggests a possible repeat of the previous explosive upward movement. Specifically, the bullish supertrend is consistent with a bullish chart setup in the weekly chart.
Last week, XRP bounced off important support at $1.96, and is now looking to close the weekly above the 1.272 Fibonacci extension level at $2.42. A decisive break above this resistance, along with sustained volume, could push the price towards the 1.618 Fibonacci extension level at $3.00.
Based on historical precedent, if XRP reflects the previous pattern, the price target may be too high. A 470% increase would target a price level of around $13.80.
At press time, XRP was trading at $2.44.
Featured image created with DALL.E, chart from TradingView.com


